Transaction graph analysis is the practice of modeling blockchain ledgers as directed graphs, where addresses, entities, or transactions become nodes and the flow of value becomes edges, so investigators and researchers can trace, cluster, and score activity mathematically instead of eyeballing block explorers. It powers three main use cases: forensic tracing of stolen funds, academic research into ledger structure, and real-time risk scoring for exchanges and DeFi protocols.
The recommended approach for most cases: model the ledger with the correct structure for its type (UTXO versus account-based), resolve raw addresses into entities using clustering heuristics, then run targeted subgraph search rather than whole-chain analysis. Where speed matters, layer in dynamic graph learning on top of static tracing.
Two numbers anchor this whole field. The largest public Bitcoin transaction graph dataset now spans 252 million nodes and 785 million edges, which is why nobody analyzes a full chain at once. And continuous-time graph attention models have shown roughly a 43% drop in false positives with sub-30ms latency in production fraud settings, which is why static analysis alone no longer cuts it for live monitoring.
Before building anything, get these decisions right:
- Pick your graph model (transaction, address/entity, or hypergraph) based on the question you’re answering, not habit.
- Select seed addresses carefully. Bad seeds waste compute on irrelevant subgraphs.
- Decide upfront whether you need a graph database like Neo4j or a batch columnar pipeline.
- Choose static tracing for post-incident forensics, dynamic learning for real-time alerting.
Key Takeaways
Transaction graph analysis works because it turns pseudonymous ledger data into traceable, quantifiable structure through the right graph model, disciplined entity resolution, and algorithms matched to the question being asked.
| Point | Details |
|---|---|
| Model choice comes first | UTXO and account-based chains need different graph structures and clustering heuristics. |
| Scale demands sampling | With datasets reaching 252 million nodes, targeted subgraph expansion beats whole-graph analysis. |
| Dynamic methods cut false positives | Continuous-time attention models showed roughly 43% fewer false positives in production testing. |
| Clustering needs documented confidence | Every entity resolution decision should carry a recorded heuristic and confidence score for legal defensibility. |
| Recovera Forensics handles escalated cases | When tracing crosses into multi-chain or legal-grade territory, Recoveraforensics builds court-ready forensic reports from wallet and transaction data. |
Table of Contents
- What Is a Transaction Graph, and Which Model Fits Your Chain?
- How Do You Collect and Clean Blockchain Data for Graph Construction?
- Which Graph Representation Should You Build First?
- How Do Address Clustering and Entity Resolution Actually Work?
- Which Tracing Algorithms and Metrics Actually Work?
- Why Do Real-Time and Dynamic Graph Methods Matter Now?
- What Engineering Patterns Handle Graphs at Scale?
- What Visualization Patterns Actually Surface Fraud Signals?
- Which Datasets and Benchmarks Support Reproducible Work?
- What Are the Real Limits, Privacy Risks, and Legal Considerations?
- What Does a Complete Forensic Workflow Look Like Start to Finish?
- How Are Machine Learning and Graph Neural Networks Changing This Field?
- How Do You Adapt This Workflow for Cross-Chain Investigations?
- What Recovera Forensics Has Learned Running These Cases
- How Recovera Forensics Supports a Transaction Graph Investigation
- Sources
- FAQ
What Is a Transaction Graph, and Which Model Fits Your Chain?
A transaction graph represents a blockchain ledger as a mathematical structure where value flows are edges and participants (or transactions themselves) are nodes. The formal version researchers rely on is the Transaction Directed Acyclic Graph, or TDAG, which defines transactions through states, witnesses, and three edge types: consuming edges (spending prior outputs), observing edges (reading state without spending), and producing edges (creating new outputs). This formal TDAG model matters because it gives you a consistent way to reason about validity and composition whether you’re looking at Bitcoin, Ethereum, or a permissioned ledger like Hyperledger Fabric.

The practical split that matters day to day is UTXO versus account-based modeling. Bitcoin’s UTXO structure means each transaction consumes specific prior outputs and creates new ones. Nodes in this graph are typically transactions or outputs, and edges represent the spending relationship. Ethereum’s account model works differently. Balances live on persistent accounts, and a transaction simply debits one account and credits another, which makes the graph resemble a more traditional flow network. This distinction changes which clustering heuristics even apply. Common-input-ownership clustering, a mainstay of Bitcoin forensics, has no real equivalent on Ethereum, because there’s no multi-input transaction structure to exploit.
Beyond the base ledger graph, analysts typically build several parallel representations from the same data:
| Graph Type | Nodes Represent | Best Suited For |
|---|---|---|
| Transaction graph | Individual transactions | Provenance tracing, timeline reconstruction |
| Address/entity graph | Wallets grouped into entities | Clustering, ownership attribution |
| Contract-invocation graph | Smart contract calls | DeFi flow analysis, exploit tracing |
| Hypergraph | Multi-party transaction groups | Modeling transactions with many inputs/outputs at once |
When you sketch a diagram for a report or paper, include timestamps on every edge, label token types on account-chain graphs, and mark which edges are consuming versus observing. That level of annotation is what separates a diagram someone can audit from one that just looks impressive.
How Do You Collect and Clean Blockchain Data for Graph Construction?
Your graph is only as good as the ledger data feeding it, and most analysis failures trace back to preprocessing, not algorithm choice.
Three data source options exist, each with tradeoffs. Running a full node and exporting blocks directly gives you the most trustworthy data but costs disk space and sync time. Archival mirrors and public dataset snapshots save that setup cost but may lag the chain tip by hours or days. RPC calls against a hosted node work fine for small, targeted queries but become slow and rate-limited at graph-construction scale. For forensic work where chain-of-custody matters, a full node export is usually worth the overhead because you control the provenance end to end.
Once you have raw data, a parsing checklist keeps errors from compounding downstream:
- Enforce strict chronological ordering. Reorgs can shuffle block order in your raw export if you’re not careful.
- Normalize fee and output amounts to a single unit (satoshis, wei) before any aggregation.
- Decode token transfers and contract calls on account-based chains. Raw transaction data alone misses ERC-20 activity entirely.
- Deduplicate transaction hashes. Some export pipelines double-count transactions across overlapping block ranges.
The errors that bite hardest are subtle: timestamp mismatches between node time and block time, raw versus normalized amount units getting mixed in a single dataset, and reorganizations silently orphaning transactions your pipeline already counted.
Pro Tip: Build your ingestion pipeline with checkpointing from day one. Running lightweight validation checks (row counts, hash uniqueness, timestamp monotonicity) after every checkpoint catches pipeline failures in minutes instead of after a multi-day batch job silently produces garbage.
Which Graph Representation Should You Build First?
The representation you choose determines which questions you can answer, and building the wrong one first wastes real engineering time.
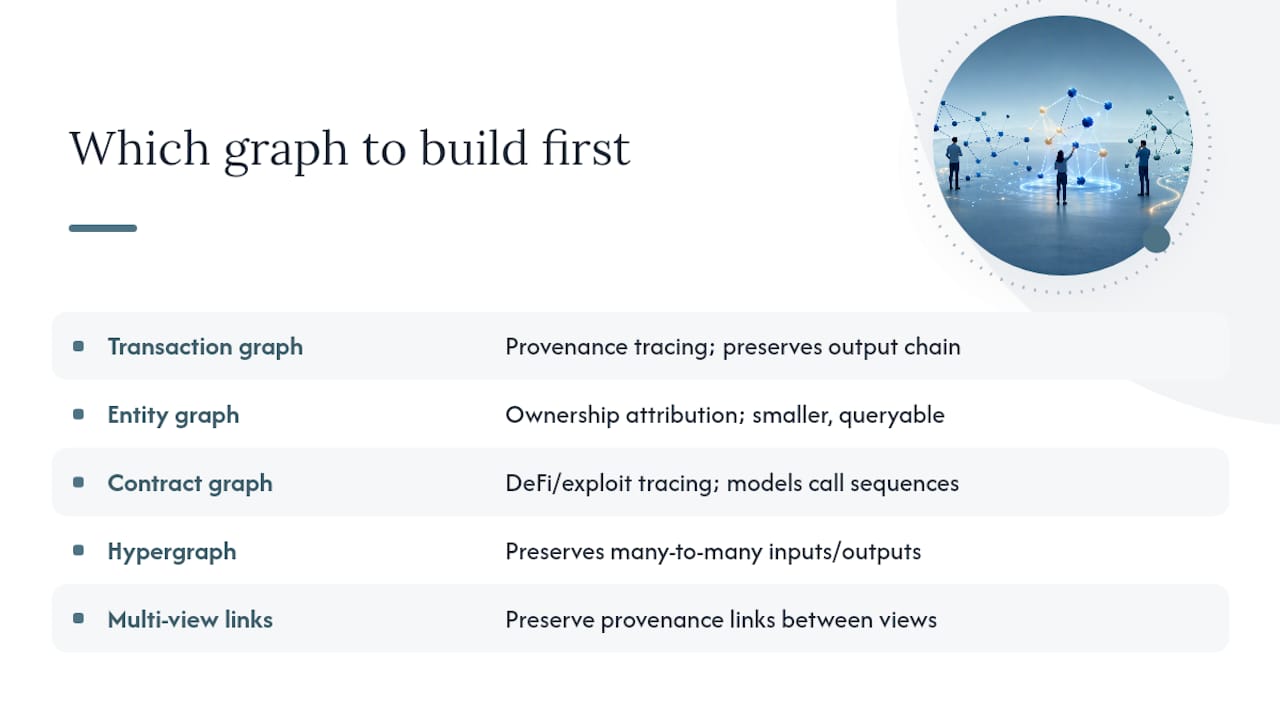
A transaction graph, where each transaction is a node and edges connect transactions that share inputs or outputs, is the right starting point for provenance tracing. You want to answer “where did this specific output eventually end up?” and this structure preserves that chain step by step. An address or entity graph collapses that detail, grouping addresses that likely belong to one owner into a single entity node. This is what you need for ownership attribution and for feeding a clustering or machine learning pipeline, since entity graphs are dramatically smaller and more queryable than raw transaction graphs.
Contract-invocation graphs matter specifically for DeFi and smart contract chains. Nodes represent contract calls rather than simple transfers, and edges capture the call sequence, which is essential for reconstructing flash loan attacks or exploit chains that touch five contracts in one block. Hypergraphs solve a structural problem the other three can’t: a Bitcoin transaction with six inputs and three outputs isn’t really a simple edge, it’s a many-to-many relationship, and hypergraph modeling preserves that instead of forcing it into misleading pairwise edges.
Practitioners increasingly build multiple representations from a single ledger pass rather than committing to one. Preserving provenance links between the views (which transaction graph node maps to which entity graph node) lets you jump between granular tracing and high-level pattern detection without reprocessing raw data twice. A graph-based visualization approach demonstrated this kind of multi-model pipeline across both Bitcoin and Ethereum, using automated graph modeling to generate transaction, address, and contract-invocation views from the same underlying data.
How Do Address Clustering and Entity Resolution Actually Work?
Raw blockchain addresses are pseudonyms, not identities, and turning thousands of addresses into a handful of real-world entities is the single biggest bottleneck in accurate attribution. This step decides whether your forensic report holds up or falls apart.
Three heuristics dominate practical clustering work:
- Common-input ownership. If multiple addresses appear as inputs to the same transaction, they’re almost certainly controlled by one entity, since spending requires the private keys for all of them. This is the workhorse Bitcoin clustering heuristic and the starting point for nearly every entity graph.
- Change address detection. Identifying which output in a transaction is “change” returning to the sender (versus a genuine payment) lets you extend a cluster without needing a multi-input transaction.
- Multi-input grouping across time. Applying common-input ownership repeatedly across a wallet’s full transaction history builds out larger clusters than any single transaction reveals.
External linking pushes clustering further: tagging addresses through OSINT (forum posts, leaked exchange data, public donation addresses), matching against known exchange deposit address ranges, and cross-referencing tagged-address datasets. Each linkage should carry a confidence score, not a binary label.
These heuristics break in predictable ways. Mixing services and CoinJoin transactions are engineered specifically to defeat common-input clustering by combining unrelated users’ coins into a single transaction. Privacy-focused wallets that avoid address reuse and randomize change outputs also degrade heuristic accuracy. Treat any cluster touching a known mixer as unreliable until corroborated independently.
Pro Tip: For anything headed to a legal proceeding, record the exact heuristic and confidence threshold behind every clustering decision. A report that says “these addresses are linked” without documenting why is far weaker in court than one that shows the reasoning chain, and conservative thresholds beat aggressive ones when your findings need to survive cross-examination.
- Never present a mixer-touched cluster as definitive ownership.
- Cross-validate high-stakes clusters with at least one external data point.
- Re-run clustering periodically. New chain activity can strengthen or contradict earlier groupings.
Which Tracing Algorithms and Metrics Actually Work?
Tracing algorithms answer “where did this money go” or “how important is this node,” and the right choice depends heavily on whether you’re working a UTXO chain or an account-based one.
- PageRank and personalized PageRank. Standard PageRank ranks nodes by overall graph importance; personalized PageRank biases that ranking toward a specific seed set, which is exactly what you want when tracing funds from a known theft address outward.
- Local push / Transaction Tracing Rank (TTR). TRacer implements a local push approach specifically for account-based chains, approximating personalized PageRank without touching the entire graph, which makes it viable at Ethereum scale where full-graph computation is impractical.
- Taint analysis. Propagates a “tainted” label from a source address outward, typically weighted by the proportion of tainted funds in each output. Simple to explain to a judge, but prone to over-tainting in busy mixing hubs.
- Random-walk methods. Simulate many random walks from a seed to estimate reachability and flow concentration, useful for probabilistic risk scoring rather than definitive tracing.
- Shortest-path and max-flow. Answer “what’s the most direct route” or “what’s the maximum value that could have moved” between two points, useful for scoping an investigation before deeper tracing.
A basic local push implementation for TTR-style ranking starts from a seed node, maintains a residual value at each visited node, and iteratively pushes a fraction of that residual to neighbors while accumulating rank at the current node, stopping once residuals drop below a threshold. This bounds computation to the local neighborhood instead of the full graph, which is the entire point.
Evaluating these methods requires real metrics, not intuition: precision and recall against a labeled ground-truth set of known-illicit addresses, hit rate for recovering a known seed from partial evidence, false-positive rate under adversarial conditions like mixing, and runtime/memory footprint at your target graph size. Build ground truth from documented cases (seized wallets, exchange-confirmed hacks) and validate with synthetic taint injection tests before trusting results on live cases.
Why Do Real-Time and Dynamic Graph Methods Matter Now?
Static tracing answers “what happened.” Increasingly, investigators and compliance teams need to know “what’s happening right now,” and that requires treating the transaction graph as a stream rather than a snapshot.
Continuous-time graph models assign genuine timestamps to edges instead of bucketing them into blocks, and temporal attention mechanisms let a model weigh recent activity more heavily than distant history when scoring a node’s risk. This matters because fraud patterns in DeFi often unfold across dozens of transactions in minutes, a timescale where static batch analysis simply arrives too late.
Streaming approaches earn their complexity specifically for real-time fraud detection and live compliance monitoring. Post-incident forensic tracing, where the funds already moved days or weeks ago, rarely needs this machinery. A dynamic graph learning framework using temporal attention showed roughly a 26% improvement in detection rate alongside the false-positive reduction mentioned earlier, while holding sub-30ms response times in a production-like scenario.
Deploying this in practice means deciding on a sliding window size (how much history each prediction considers), an edge retention policy (when to prune old edges from active memory), and accepting a latency-versus-accuracy tradeoff that usually favors shorter windows for alerting and longer ones for periodic deep review.
Pro Tip: Don’t replace your rule-based triggers with a dynamic learner. Combine them: cheap graph-pattern rules catch the obvious cases instantly, and route only the ambiguous ones to the heavier temporal model, which keeps compute costs sane at scale.
- Use streaming models for live alerting, static tracing for closed-case forensics.
- Shorter sliding windows favor speed; longer ones favor accuracy.
- Prune aggressively. Retaining every historical edge in active memory doesn’t scale.
What Engineering Patterns Handle Graphs at Scale?
At 785 million edges, naive whole-graph queries simply don’t finish. Three architecture patterns cover most real deployments: batch processing on columnar stores for large-scale historical analysis, graph-database-backed exploration for interactive investigation, and streaming pipelines for anything requiring near-real-time updates.
Graph databases like Neo4j earn their place specifically for interactive, query-driven exploration, letting an analyst run a Cypher query and get a subgraph back in seconds rather than writing custom traversal code. For raw historical batch processing across the full chain, a columnar or specialized blockchain-processing approach tends to outperform a graph database on throughput.
Subgraph expansion needs limits or it explodes combinatorially. Breadth-first expansion capped at two or three hops from a seed node, combined with locality-based sampling that prioritizes high-value or recently active neighbors, keeps investigations tractable without losing the signal that matters.
- Index on address and timestamp at minimum. Most queries filter on both.
- Shard by time range for historical stores, and by entity cluster for graph databases when volume demands it.
- Size memory for your working subgraph, not the full chain. Most queries never need the whole graph in memory.
Pro Tip: Keep an immutable raw ledger export separate from your derived graphs. If a heuristic changes or a bug surfaces six months into a case, regenerating the graph from untouched raw data is the only way to prove your findings are reproducible.
What Visualization Patterns Actually Surface Fraud Signals?
Certain shapes in a transaction graph are visual shorthand for specific behaviors, and learning to recognize them by sight speeds up triage enormously. A peeling chain, where a large input repeatedly splits off a small amount while the remainder moves forward, often signals someone slowly cashing out through many hops to avoid detection. A fan-out, one address suddenly spraying funds to dozens of destinations, often indicates a mixing attempt or a distribution to cash-out mules. Rapid pass-through nodes, where funds arrive and leave within minutes, flag likely automated laundering infrastructure.
Rather than staring at a force-directed layout hoping a pattern jumps out, query for it directly.
- Rely on programmatic filters at scale. Raw force-directed graphs above a few hundred nodes become visual noise fast.
- Use desktop graph database clients for deep investigative queries, and web explorers for quick lookups or client-facing walkthroughs.
- Export filtered subgraphs to visualization tools only after query-driven pruning, not before.
Pro Tip: Treat visualization as the last step of an investigation, not the first. Cluster and query first, then visualize the pruned result. Investigators who visualize raw data first tend to chase patterns that are just an artifact of graph density.
Which Datasets and Benchmarks Support Reproducible Work?
Reproducibility separates a defensible forensic report or publishable paper from an unverifiable claim, and that starts with citing real, checkable data.
A defensible reporting checklist covers dataset provenance (where the raw export came from and when), every processing step applied, which clustering heuristics were used and at what confidence threshold, and the evaluation metrics used to validate findings. Publish code alongside data wherever possible, and when ground truth involves real victims, anonymize identifying details while preserving the structural relationships that make the dataset useful to other researchers.
What Are the Real Limits, Privacy Risks, and Legal Considerations?
Every transaction graph technique has a ceiling, and pretending otherwise is how forensic work loses credibility in court or peer review.
Blockchains are pseudonymous, not anonymous, and that distinction cuts both ways. Public ledgers can be deanonymized, as early Bitcoin graph research demonstrated by linking scraped forum identities to wallet clusters tied to Silk Road activity. But mixing services, off-chain transfers, and cross-chain bridges introduce real attribution uncertainty that no algorithm fully resolves. Treat every clustering result as probabilistic, not definitive.
Ethical and legal guardrails matter as much as technical rigor:
- Never publish a public accusation against a named individual without independent corroboration beyond graph inference alone.
- Document confidence levels explicitly. “Likely linked” and “confirmed linked” are not interchangeable in a legal filing.
- Preserve chain of custody on every dataset touched, and keep processing steps repeatable so opposing counsel or a peer reviewer can reproduce your result.
- Escalate to law enforcement or retain qualified legal counsel once a case moves from analysis toward asset seizure or prosecution.
The main risk mitigations worth building into any workflow: conservative clustering thresholds for anything client-facing, corroboration from at least one non-chain data source before naming an entity, and a written record of every heuristic’s assumptions so a false positive can be traced back and corrected rather than silently propagating through a report.
Pro Tip: When a finding feels too clean, especially a clustering result that neatly implicates one specific person, that is exactly the moment to slow down and look for a mixing service or shared custodial wallet hiding in the chain.
What Does a Complete Forensic Workflow Look Like Start to Finish?
A repeatable, defensible process turns a scattered set of techniques into a case file that holds up under scrutiny.
- Seed selection. Identify the confirmed starting point, typically a victim’s known wallet or a flagged transaction hash, and document why it was chosen.
- Subgraph expansion. Pull a bounded neighborhood (two to three hops, or wider if volume allows) around the seed rather than attempting full-graph analysis.
- Entity clustering. Apply common-input and change-detection heuristics, recording confidence scores for every grouping decision.
- Algorithmic tracing. Run personalized PageRank, taint propagation, or shortest-path analysis depending on the question, and archive every query used to generate results.
- Evidence collection. Snapshot the exact node and edge states referenced in findings, since live chain data changes as new blocks arrive.
- Validation. Cross-check clustering and tracing conclusions against at least one external data point (exchange confirmation, OSINT, prior case data).
- Reporting. Compile findings into a structured report with methodology, confidence statements, and supporting exhibits.
A report built for legal use needs specific sections: a plain-language summary, full methodology with heuristic provenance, a chain of custody statement, and confidence levels attached to every major claim rather than a single blanket assertion of certainty.
Pro Tip: Archive raw query outputs, not just summarized conclusions, as court exhibits. A screenshot of a conclusion is far weaker evidence than the reproducible query that generated it, and having a colleague independently rerun your key queries before filing catches errors a solo review misses.
How Are Machine Learning and Graph Neural Networks Changing This Field?
Graph neural networks extend everything above by learning patterns directly from graph structure instead of relying purely on hand-built heuristics. A GNN can absorb transaction amount, timestamp, and topology simultaneously and produce a risk score, something no single heuristic does on its own.
Combining graph attention networks with temporal models like LSTMs has shown real gains in identifying suspicious accounts, particularly through dynamic subgraph sampling that addresses the class imbalance problem endemic to fraud detection, where legitimate transactions vastly outnumber illicit ones in any training set. This combined GAT-LSTM approach lets the model weight both structural position in the graph and behavior over time, catching accounts that look normal in isolation but suspicious in sequence.
The practical implication for investigators: GNN-based scoring works best as a triage layer that flags candidate clusters for human review, not as a standalone verdict. False positives remain common enough that a GNN score should trigger deeper heuristic investigation, not a conclusion. Training data quality matters more than model architecture here. A model trained on a narrow set of past scams will miss novel laundering patterns entirely, which is why continuous retraining against fresh labeled cases matters more in this domain than in most machine learning applications.
How Do You Adapt This Workflow for Cross-Chain Investigations?
Funds rarely stay on one chain anymore. Bridges, wrapped assets, and cross-chain swaps mean a real investigation often has to follow value from Bitcoin into Ethereum, or from Ethereum into a Layer 2, and back out again.
The formal TDAG model helps here specifically because it’s chain-agnostic. Since it defines transactions through states, witnesses, and edge types rather than chain-specific structures, you can compose graphs across a UTXO chain and an account-based chain using the same underlying framework, treating a bridge transaction as a special edge type that connects two otherwise separate graphs.
In practice, cross-chain tracing means treating bridge contracts and swap protocols as connector nodes with their own invocation graph, then stitching entity clusters from one chain to the next wherever a bridge transaction provides a verifiable link. The biggest practical challenge is timing correlation. A deposit on one chain and a withdrawal on another, minutes or hours apart with matching amounts, is often the only signal tying two otherwise disconnected graphs together, and that correlation gets noisier the more hops and the more time elapses between them.
This is also where mixing risk compounds. A launderer routing funds through two or three chains before cashing out faces less scrutiny than one staying on a single, heavily-monitored chain, simply because most forensic tooling still analyzes chains in isolation rather than as a connected system.
What Recovera Forensics Has Learned Running These Cases
Every heuristic in this guide sounds clean on paper. Real cases are messier: victims often only have a transaction hash and a sense of panic, and the graph rarely cooperates by staying inside one clean cluster.
What holds up in practice is conservative clustering paired with documentation discipline. Clients who come to Recoveraforensics after a scam typically need their transaction history reconstructed from scratch, entity clusters built with enough confidence to name real recipients, and a report that a court or a law enforcement agency can actually act on. That last part is where a lot of informal tracing attempts fall short. A convincing graph on someone’s screen is not the same as a chain-of-custody-documented report ready for legal proceedings.
The victim-centered process Recoveraforensics built exists because the technical work only matters if it produces something usable: a report that connects wallet activity to a fraud network with enough rigor to survive scrutiny, not just a diagram that looks convincing.
How Recovera Forensics Supports a Transaction Graph Investigation
Everything covered here, from entity clustering to cross-chain tracing to court-ready documentation, is exactly the work Recoveraforensics does for clients who need results, not just methodology. When a case moves past what a solo analyst can reasonably handle (multi-chain fund movement, mixing services, or evidence that needs to hold up in a legal filing), that’s the threshold for bringing in a specialist.
Recoveraforensics builds forensic reports by combining wallet activity analysis, OSINT investigation, and blockchain tracing techniques into documentation suitable for law enforcement and civil proceedings. Before reaching out, gather what you have: transaction hashes, wallet addresses involved, approximate dates, and any communication with the scammer. That’s usually enough to start scoping a case.
The output is a technical report connecting the fraud network to specific wallet activity, built with the same conservative, documented approach this guide recommends throughout. If you’re evaluating whether your case needs professional forensic support, the contact and recovery intake page walks through what to submit first, and the full service breakdown covers what a completed investigation includes.
Sources
- TRacer: Scalable transaction tracing for account-based blockchains (arXiv, 2022)
- Visualizing blockchain transaction behavioural patterns: a graph-based approach (TechRxiv, 2023)
FAQ
What is blockchain analysis?
Blockchain analysis is the process of examining public ledger data, typically through transaction graphs, to trace fund flows, identify entities behind addresses, and detect suspicious patterns like fraud or money laundering.
How can I analyze a crypto chart to spot suspicious activity?
Price charts alone don’t reveal on-chain fraud. Analysts instead examine the transaction graph itself, looking for patterns like fan-outs, peeling chains, or rapid pass-throughs that signal laundering rather than legitimate trading.
How do I check a blockchain transaction?
Any transaction hash can be looked up on a public block explorer to see its inputs, outputs, timestamp, and confirmation status, but tracing where funds moved afterward requires building out the surrounding transaction graph.
What is a blockchain transaction, exactly?
A blockchain transaction is a signed, timestamped record that moves value between addresses (in UTXO chains) or accounts (in account-based chains), and becomes a permanent edge in the network’s transaction graph once confirmed.
When should I hire a forensic investigator instead of tracing funds myself?
Once a case involves multiple chains, mixing services, or documentation intended for law enforcement or a legal filing, specialist support like Recoveraforensics typically produces more defensible results than informal tracing.